1992
2007
2021
TX
FL
OK
LA
MS
AL
GA
AZ
NM
KS
AR
TN
NC
SC
DC
CA
UT
CO
NE
MO
KY
WV
VA
MD
DE
OR
NV
WY
SD
IA
IN
OH
PA
NJ
CT
RI
WA
ID
MT
ND
MN
IL
MI
NY
MA
WI
VT
NH
ME
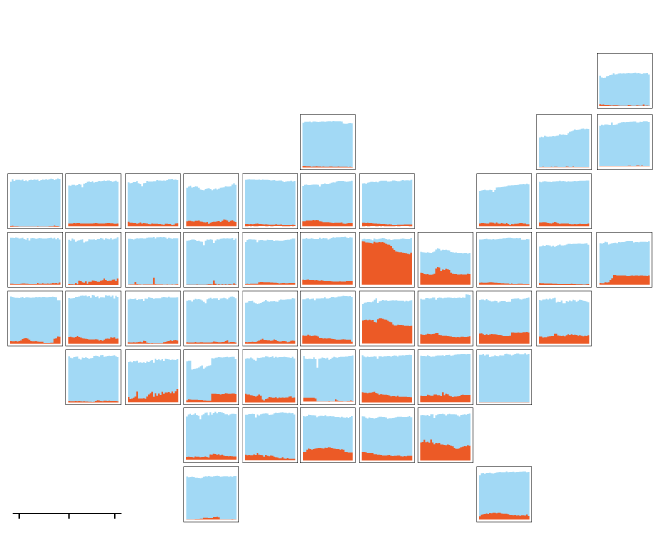
For each state, the stacked bar charts are showing the percent of library funding coming from state,
local and other sources of funding between the years 1992 and 2021.
Unlike most states where library budgets primarily rely on local funds,
Ohio's public libraries are predominantly funded by state government contributions.
1992
2007
2021
TX
FL
OK
LA
MS
AL
GA
AZ
NM
KS
AR
TN
NC
SC
DC
CA
UT
CO
NE
MO
KY
WV
VA
MD
DE
OR
NV
WY
SD
IA
IN
OH
PA
NJ
CT
RI
WA
ID
MT
ND
MN
IL
MI
NY
MA
WI
VT
NH
ME
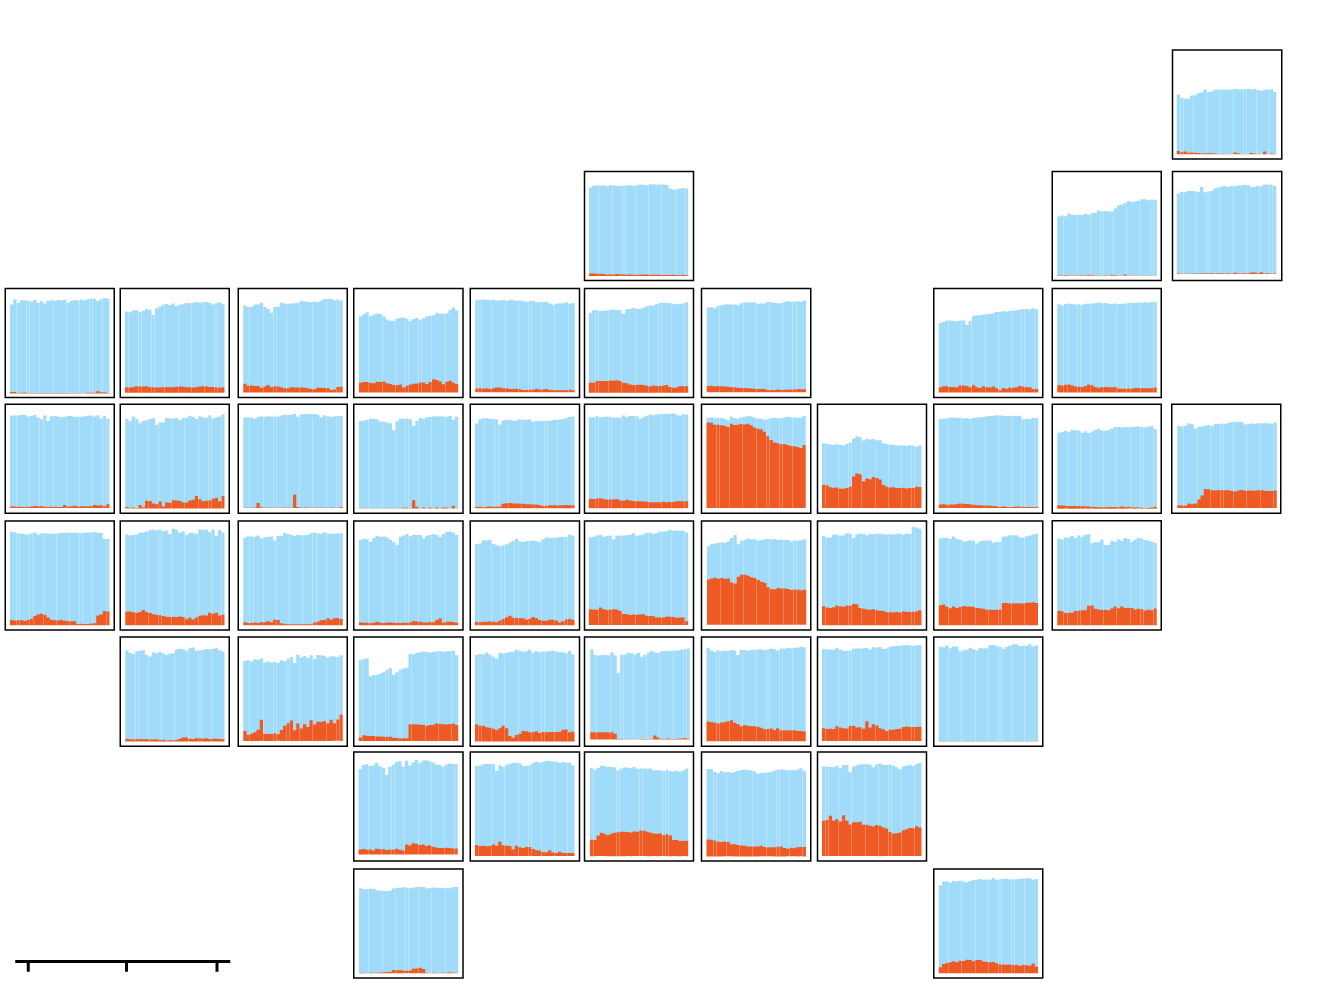
For each state, the stacked bar charts are showing the percent of library funding coming from state,
local and other sources of funding between the years 1992 and 2021.
Unlike most states where library budgets primarily rely on local funds,
Ohio's public libraries are predominantly funded by state government contributions.

1992
2007
2021
TX
FL
OK
LA
MS
AL
GA
AZ
NM
KS
AR
TN
NC
SC
DC
CA
UT
CO
NE
MO
KY
WV
VA
MD
DE
OR
NV
WY
SD
IA
IN
OH
PA
NJ
CT
RI
WA
ID
MT
ND
MN
IL
MI
NY
MA
WI
VT
NH
ME
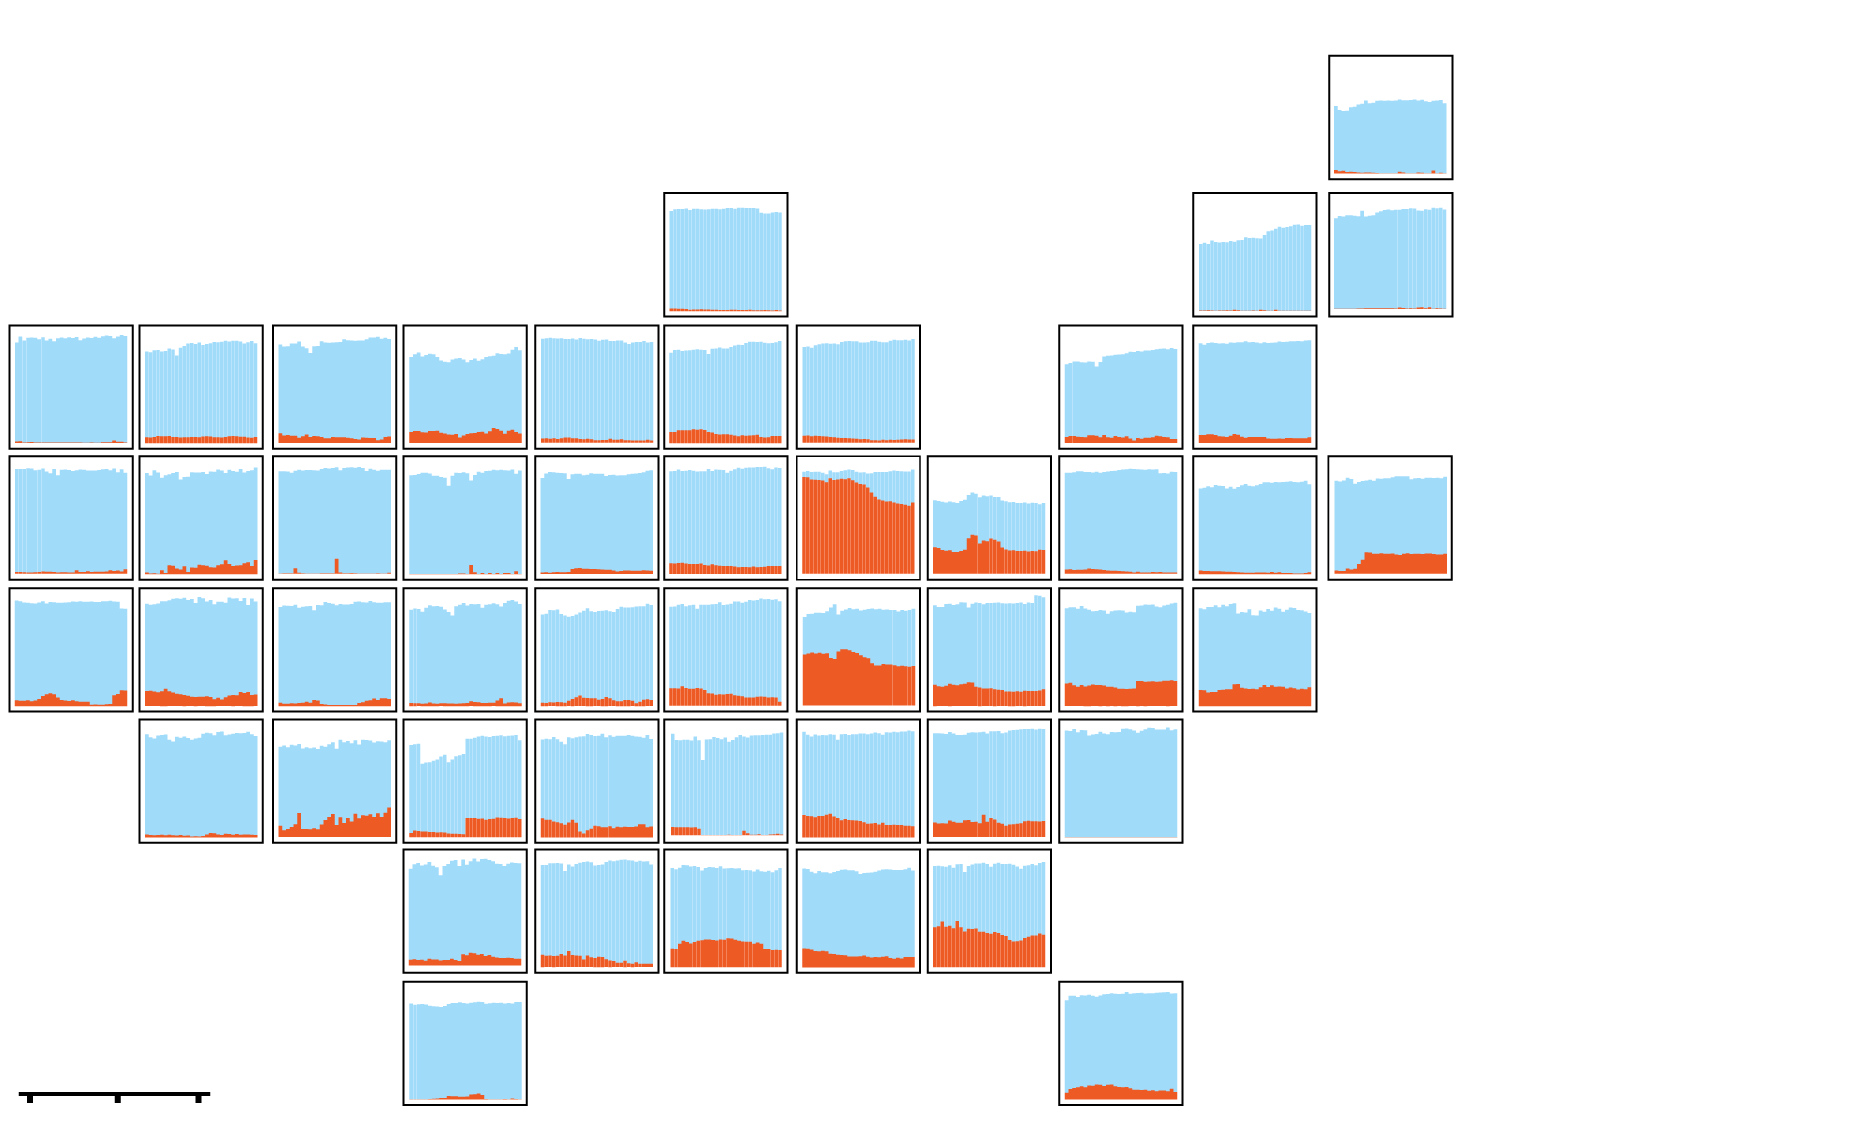
For each state, the stacked bar charts are showing the percent of library funding coming from state,
local and other sources of funding between the years 1992 and 2021.
Unlike most states where library budgets primarily rely on local funds,
Ohio's public libraries are predominantly funded by state government contributions.